365 Days of Electronic Dance Music on YouTube

Introduction
While some say that electronic dance music is just a fad, it is undoubtedly one of the most popular music genres today.
Though I am kind of an older armchair EDM fan and not the young party animal, I was curious to see how the genre evolves over time and started brainstorming about a potential analysis, and so more than a year ago I’ve set up a small script that started collecting data.
At the beginning I have asked fairly simple questions like “Which are the most popular songs?” and “How did they become popular: instantly or gradually?”, but as I was getting the answers, more and more questions have arisen and many unexpected patterns have been discovered.
In the following I present the results of my analysis and I hope you too will find some interesting bits and pieces about the worldwide EDM community.
Dataset
The analysis is based on the content uploaded to YouTube channels dedicated to electronic dance music. The following channels were being monitored:
 anjunabeats
 anjunadeep
 armadamusic
 blancoynegro
 dimmakrecords
 happymusic
 kontor
 ministryofsoundde
 mostv
mostv
 musicalfreedomrecs
 pandoramuslc
 planetpunkmusic
 spinninrec
 toolroomrecords
 ultrarecords
 zoolandmusicgmbh
Though data collection was started a bit earlier, only the period between 1 July, 2015 and 1 July, 2016 is part of the analysis. Only newly uploaded content was tracked (videos that were uploaded before July 2015 were ignored).
| 2015 | |||||||||||
|---|---|---|---|---|---|---|---|---|---|---|---|
| Jan | Feb | Mar | Apr | May | Jun | Jul | Aug | Sep | Oct | Nov | Dec |
| 2016 | |||||||||||
|---|---|---|---|---|---|---|---|---|---|---|---|
| Jan | Feb | Mar | Apr | May | Jun | Jul | Aug | Sep | Oct | Nov | Dec |
Uploads and Views
The number of uploads shows how much new music is getting released by EDM record labels (supply) and the number of views can tell us whether people are actually interested in that new content (demand).
Daily Uploads
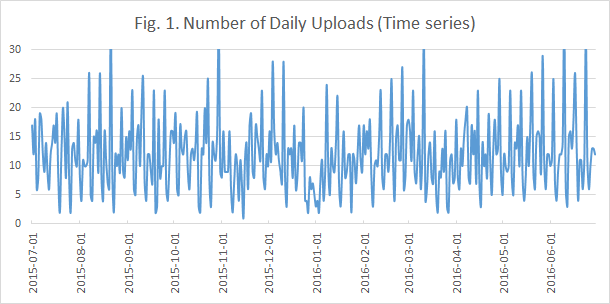
The number of daily uploads over the last 12 months were quite balanced, there is no statistically significant general upward or downward trend in the series. A noticeable big drop happened between 28 Dec 2015 and 3 Jan 2016 (the middle of Fig. 1.): labels were taking a break on the week of New Year’s Eve.
While some of the spikes are caused by a single channel uploading many videos at once (e.g. an entire artist album), the day of the week breakdown reveals a general pattern:
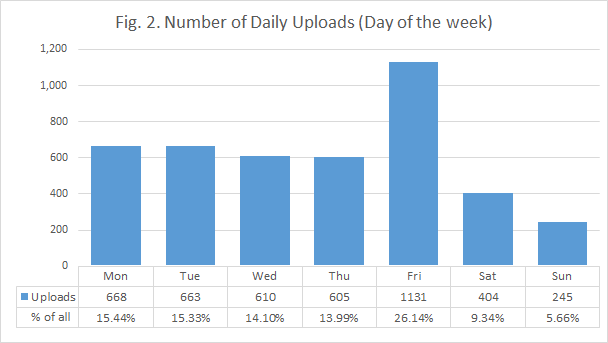
As one would expect, the least number of uploads are made on Saturday and Sunday. Labels in general are more likely to release new music just before the weekend: 1 in 4 of new uploads are made on Friday. The beginning of the week, Monday and Tuesday, are also a popular choice for uploading new content, these two days combined with Friday are responsible for 57% of all uploads.
Daily Views
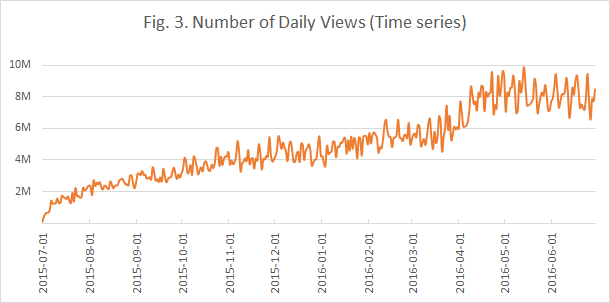
As compared to the number of daily uploads, there is a general upward trend in the number of daily views. The spring of 2016 has brought an increased demand for EDM which is still maintained for the current months.
Important note: though Fig. 3. shows the rate at which views were captured, it cannot be used as a measure of absolute growth. In other words: the popularity of EDM on YouTube did not grow by a factor of 4 in the last 12 months!
Let’s look at the day of the week breakdown of views:
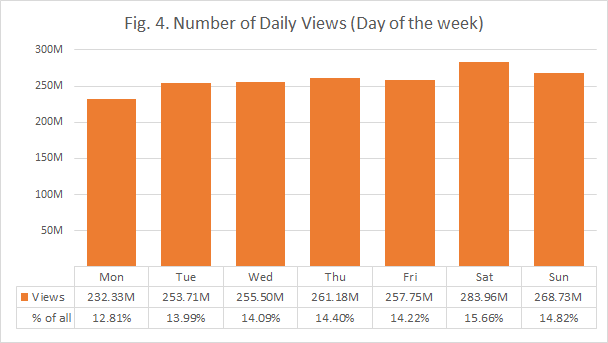
A higher than average number of views are recorded on weekends, especially on Saturdays. Not surprisingly, the number of views on Mondays are the lowest.
Uploads vs. Views
Fig. 5. shows the relative difference of the actual data to a situation where the number of daily uploads and views were equal for all days of the week:
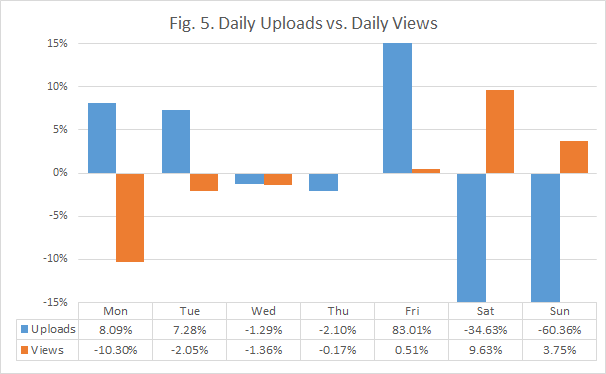
Even tough that the number of uploads on an average Monday is 8% higher than the rest of the week, the number of views are 10% lower as compared to other days. Similarly, despite that on a typical Friday there are 83% more uploads as we would expect, it doesn’t attract significantly more views than the other days of the week.
Both Wednesday and Thursday has less than average number of uploads and views: it seems that both the labels and the fans are waiting for the weekend.
Popularity
Some songs quickly become very popular, others never get more than a few thousand views. While no amount of data will ever tell what exactly makes a hit, it can tell which songs can be considered as such.
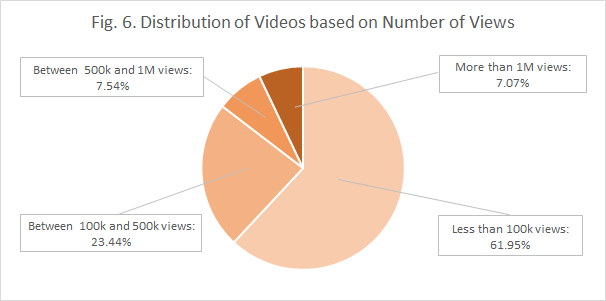
Distribution of Views
| Count | Share | Views | Share | |
|---|---|---|---|---|
| Less than 100,000 views: | 2,680 | 61.95% | 66.29M | 3.66% |
| Between 100,000 and 500,000 views: | 1,014 | 23.44% | 250.41M | 13.81% |
| Between 500,000 and 1,000,000 views: | 326 | 7.54% | 230.13M | 12.69% |
| More than 1,000,000 views: | 306 | 7.07% | 1,266.33M | 70.42% |
Fig. 6. shows how unequal the popularity of the songs are. Videos that reached at least 500,000 views (15% of all uploads) account for 83% of all views and the rest of them (85% of all uploads) got only 17% of the views.
To be in the top 10% based on views, a video must have been played at least 730,000 times and only 24 of all the 4,326 uploads (0.55%) has reached more than 10 million views.
Top 50 Most viewed EDM Songs (July 2015 – July 2016)
| # | Title | Uploader | Upload date | Views |
|---|---|---|---|---|
| 1 | ultrarecords | Mar 7, 2016 | 85.01M | |
| 2 | ultrarecords | Sep 16, 2015 | 53.02M | |
| 3 | kontor | Dec 14, 2015 | 49.03M | |
| 4 | ultrarecords | Apr 7, 2016 | 41.49M | |
| 5 | ultrarecords | Jul 31, 2015 | 27.69M | |
| 6 | spinninrec | Sep 23, 2015 | 26.63M | |
| 7 | spinninrec | Feb 19, 2016 | 25.82M | |
| 8 | spinninrec | Oct 23, 2015 | 25.18M | |
| 9 | kontor | Oct 8, 2015 | 21.37M | |
| 10 | spinninrec | Jul 27, 2015 | 21.24M | |
| Check the full list as a |
||||
The problem with determining the popularity of a song based on the absolute number of views it has received is that it favors older uploads (because in general, the more time elapsed since upload, the more views an upload has).
Growth
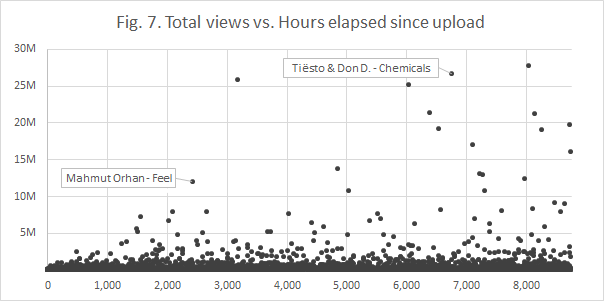
We need to take a look on growth to better understand which songs are the currently most popular ones.
For example, an upload with 25M views but an age of ~7000 hours (~290 days) is less popular currently than the one that reached 10M views and was uploaded ~2000 hours (~80 days) ago.
On Fig. 7. each dot represents a video: the horizontal axis shows how many hours elapsed since it was uploaded (1000 hours is about 42 days) and the vertical axis shows the number of views it got:
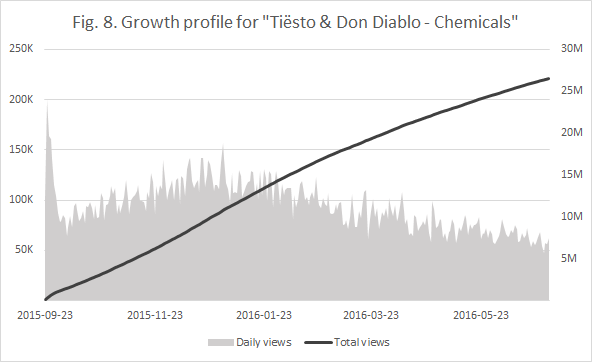
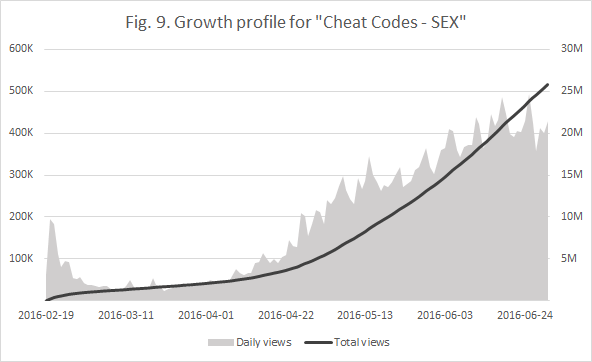
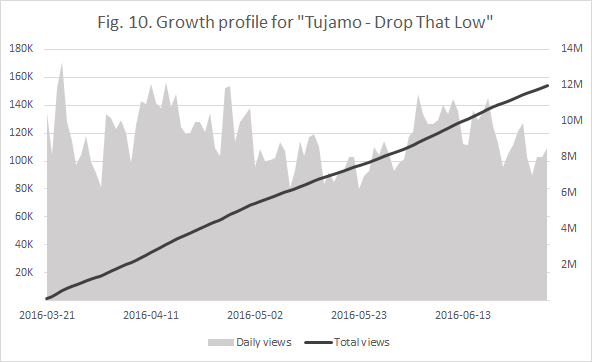
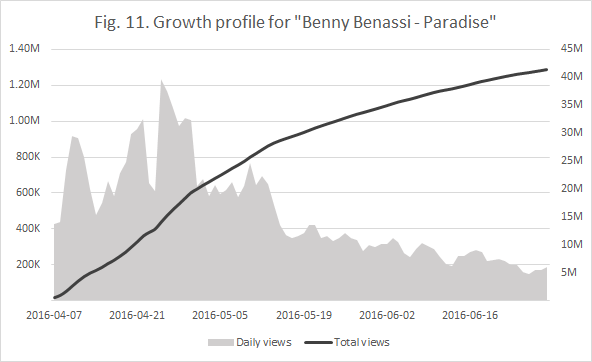
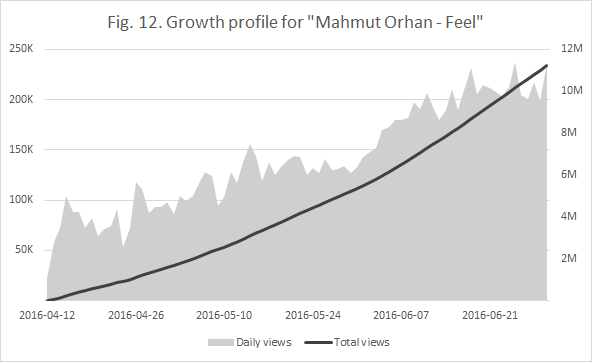
There are so many factors influencing the number of views a song gets that each of them has a unique growth profile. Figures 8 – 12. provide examples of such growth profiles: on the left side you can see the number of daily views (grey area) and the number of total views on the right side (black line).
Tiësto & Don Diablo – Chemicals was uploaded in late September and was getting more and more popular throughout the rest of 2015:
After an initial short burst, Cheat Codes x Kris Kross Amsterdam – SEX was forgotten, but made a comeback in early April and got into a very strong upward trend:
Tujamo – Drop That Low has managed to maintain its popularity since its release in March 2016:
Although Benny Benassi & Chris Brown – Paradise is quickly losing its popularity, it still gets 200k views a day:
Mahmut Orhan feat. Sena Sener – Feel is an example of song that was uploaded recently and is getting more and more popular day by day:
Top 50 EDM Songs of Summer 2016
Based on the analysis of the growth profiles I have compiled a list of the songs that are likely to dominate the sound of summer 2016 (Age and Views are of 1 July 2016, Age is the days elapsed since the date it was uploaded):
| # | Title | Uploader | Age | Views |
|---|---|---|---|---|
| 1 | spinninrec | 2 | 618.13k | |
| 2 | spinninrec | 1 | 223.36k | |
| 3 | ultrarecords | 79 | 11.27M | |
| 4 | spinninrec | 3 | 435.81k | |
| 5 | spinninrec | 83 | 10.70M | |
| 6 | spinninrec | 20 | 2.50M | |
| 7 | pandoramuslc | 0 | 50.00k | |
| 8 | ultrarecords | 65 | 7.26M | |
| 9 | ultrarecords | 1 | 95.24k | |
| 10 | spinninrec | 5 | 519.33k | |
| Check the full list as a |
||||
Keep in mind that this is just one of the many possible ways to rank the songs based on their potential to become the major hits of summer 2016 (and some of them are already have became), so don’t be offended if your favorite new song is not on the list!
Top record Labels
Finding out which record labels are the top ones based on YouTube views is not a straightforward task because not only that each label puts a different emphasis on this distribution channel, their artists usually have their own YouTUbe channels which are not part of the dataset.
While it would be risky to draw conclusions about the exact market share of each label based on the data available, it is safe to say that the top 5 EDM labels are as the following: Spinnin’ Records, Ultra Music, Kontor Records, Armada Music, and Proximity.

This fact comes by no surprise considering that these are among the EDM labels that were started the earliest (Kontor and Ultra in 1995, Spinnin’ in 1999, Armada in 2003). However, it is worth to note that Proximity was started in 2009 and it is already the 5th most popular YouTube channel for EDM.
Conclusions
Though this analysis is based solely on one platform, it provides widescale insights into the worldwide EDM community. The key points are:
-
The popularity of EDM on YouTube is still increasing: labels supply a steady flow of new content and fans watch more and more of it.
-
Only 1 in 14 releases (7%) become hits (more than 1M views) and 1 in 180 (0.55%) megahits (more than 10M views).
-
Although five record labels dominate the scene, smaller labels can find success as well because the environment is constantly changing.
The music industry is so complex that predicting future hits is impossible, but seeing what resonates with the audience is essential in supporting an artist’s career. While this report shows what happened, record labels could gain actionable insights by getting to know why it happened so.
When will the bass drop?
Has EDM already reached its peak or it will become even more popular in the coming years? Only time can tell that for sure but currently there’s no sign of any slowdown!
 When Will The Bass Drop? (a satirical video about EDM music)
Update: Blogosphere coverage
I submitted my analysis to /r/edm and, to my biggest surprise, a few blogs have picked it up and published their own articles on it:
-
EDM Analysis Predicts Summer 2016’s Biggest Hits https://www.youredm.com/2016/07/09/edm-analysis-predicts-summer-2016s-biggest-hits/
-
Blogger presents YouTube analytics of top EDM channels from last year https://dancingastronaut.com/2016/07/fan-analyzes-365-days-edm-youtube/
-
New EDM Study Predicts the Top 10 Tracks that Will Dominate the Summer of 2016 http://edmnations.com/new-edm-study-predicts-the-top-10-tracks-that-will-dominate-the-summer-of-2016/
-
Study Shows 7% of EDM Tracks Go Viral http://news.bpmsupreme.com/study-shows-7-edm-tracks-go-viral/
Appendix
List #1: Top 50 Most viewed EDM Songs (July 2015 – July 2016)
| # | Title | Uploader | Upload date | Views |
|---|---|---|---|---|
| 1 | ultrarecords | Mar 7, 2016 | 85.01M | |
| 2 | ultrarecords | Sep 16, 2015 | 53.02M | |
| 3 | kontor | Dec 14, 2015 | 49.03M | |
| 4 | ultrarecords | Apr 7, 2016 | 41.49M | |
| 5 | ultrarecords | Jul 31, 2015 | 27.69M | |
| 6 | spinninrec | Sep 23, 2015 | 26.63M | |
| 7 | spinninrec | Feb 19, 2016 | 25.82M | |
| 8 | spinninrec | Oct 23, 2015 | 25.18M | |
| 9 | kontor | Oct 8, 2015 | 21.37M | |
| 10 | spinninrec | Jul 27, 2015 | 21.24M | |
| 11 | kontor | Jul 3, 2015 | 19.73M | |
| 12 | spinninrec | Oct 2, 2015 | 19.16M | |
| 13 | ultrarecords | Jul 22, 2015 | 19.10M | |
| 14 | spinninrec | Sep 8, 2015 | 17.04M | |
| 15 | kontor | Jul 2, 2015 | 16.02M | |
| 16 | spinninrec | Dec 11, 2015 | 13.76M | |
| 17 | spinninrec | Sep 3, 2015 | 13.08M | |
| 18 | pandoramuslc | Sep 1, 2015 | 12.92M | |
| 19 | spinninrec | Aug 3, 2015 | 12.42M | |
| 20 | spinninrec | Mar 21, 2016 | 11.98M | |
| 21 | ultrarecords | Apr 12, 2016 | 11.27M | |
| 22 | spinninrec | Aug 31, 2015 | 10.78M | |
| 23 | ultrarecords | Dec 3, 2015 | 10.71M | |
| 24 | spinninrec | Apr 8, 2016 | 10.70M | |
| 25 | spinninrec | Jul 13, 2015 | 9.14M | |
| 26 | spinninrec | Jul 6, 2015 | 8.92M | |
| 27 | kontor | Jul 29, 2015 | 8.32M | |
| 28 | ultrarecords | Sep 30, 2015 | 8.21M | |
| 29 | ultrarecords | Aug 19, 2015 | 7.98M | |
| 30 | kontor | Jul 9, 2015 | 7.96M | |
| 31 | pandoramuslc | Apr 4, 2016 | 7.90M | |
| 32 | spinninrec | Mar 11, 2016 | 7.87M | |
| 33 | ultrarecords | Nov 13, 2015 | 7.65M | |
| 34 | ultrarecords | Jan 14, 2016 | 7.59M | |
| 35 | ultrarecords | Apr 26, 2016 | 7.26M | |
| 36 | spinninrec | Nov 11, 2015 | 6.95M | |
| 37 | kontor | Sep 7, 2015 | 6.93M | |
| 38 | spinninrec | Nov 19, 2015 | 6.70M | |
| 39 | spinninrec | Apr 7, 2016 | 6.65M | |
| 40 | spinninrec | Dec 29, 2015 | 6.36M | |
| 41 | spinninrec | Oct 19, 2015 | 6.33M | |
| 42 | zoolandmusicgmbh | Aug 27, 2015 | 6.27M | |
| 43 | ultrarecords | Dec 21, 2015 | 5.90M | |
| 44 | spinninrec | Jul 20, 2015 | 5.83M | |
| 45 | spinninrec | Apr 29, 2016 | 5.55M | |
| 46 | ultrarecords | Aug 27, 2015 | 5.22M | |
| 47 | spinninrec | Apr 29, 2016 | 5.18M | |
| 48 | spinninrec | Jan 27, 2016 | 5.18M | |
| 49 | spinninrec | Jan 29, 2016 | 5.13M | |
| 50 | spinninrec | Mar 14, 2016 | 5.01M | |
| Check the list as a |
||||
List #2: Top 50 EDM Songs of Summer 2016 (Prediction)
| # | Title | Uploader | Age | Views |
|---|---|---|---|---|
| 1 | spinninrec | 2 | 618.13k | |
| 2 | spinninrec | 1 | 223.36k | |
| 3 | ultrarecords | 79 | 11.27M | |
| 4 | spinninrec | 3 | 435.81k | |
| 5 | spinninrec | 83 | 10.70M | |
| 6 | spinninrec | 20 | 2.50M | |
| 7 | pandoramuslc | 0 | 50.00k | |
| 8 | ultrarecords | 65 | 7.26M | |
| 9 | ultrarecords | 1 | 95.24k | |
| 10 | spinninrec | 5 | 519.33k | |
| 11 | spinninrec | 10 | 949.99k | |
| 12 | spinninrec | 5 | 473.59k | |
| 13 | pandoramuslc | 87 | 7.90M | |
| 14 | spinninrec | 62 | 5.55M | |
| 15 | pandoramuslc | 1 | 126.39k | |
| 16 | spinninrec | 62 | 5.18M | |
| 17 | spinninrec | 3 | 253.13k | |
| 18 | spinninrec | 84 | 6.65M | |
| 19 | spinninrec | 2 | 178.89k | |
| 20 | spinninrec | 111 | 7.87M | |
| 21 | spinninrec | 6 | 459.04k | |
| 22 | spinninrec | 52 | 3.60M | |
| 23 | spinninrec | 55 | 3.82M | |
| 24 | spinninrec | 22 | 1.45M | |
| 25 | spinninrec | 35 | 2.31M | |
| 26 | happymusic | 31 | 2.04M | |
| 27 | kontor | 23 | 1.46M | |
| 28 | pandoramuslc | 2 | 141.52k | |
| 29 | pandoramuslc | 17 | 1.04M | |
| 30 | pandoramuslc | 4 | 243.36k | |
| 31 | spinninrec | 20 | 1.14M | |
| 32 | spinninrec | 30 | 1.65M | |
| 33 | spinninrec | 73 | 3.96M | |
| 34 | ultrarecords | 90 | 4.70M | |
| 35 | spinninrec | 3 | 180.96k | |
| 36 | spinninrec | 7 | 352.20k | |
| 37 | spinninrec | 44 | 2.15M | |
| 38 | spinninrec | 17 | 829.99k | |
| 39 | spinninrec | 16 | 777.81k | |
| 40 | spinninrec | 14 | 636.25k | |
| 41 | spinninrec | 108 | 5.01M | |
| 42 | spinninrec | 27 | 1.25M | |
| 43 | spinninrec | 4 | 191.57k | |
| 44 | spinninrec | 6 | 242.17k | |
| 45 | spinninrec | 20 | 837.68k | |
| 46 | pandoramuslc | 3 | 135.67k | |
| 47 | ultrarecords | 1 | 53.90k | |
| 48 | spinninrec | 9 | 372.62k | |
| 49 | pandoramuslc | 6 | 246.82k | |
| 50 | ultrarecords | 104 | 4.02M | |
| Check the list as a |
||||